Scenarios
RDAF has broad applicability within the enterprise data landscape, and the initial focus has been to apply RDAF to solve AIOps & Observability problems.

Following are few AIOps related example use cases and scenarios that can be solved with RDAF pipelines. Each scenario provides pipeline configuration (Low-Code) and dataset visualization, wherever applicable.
Unsupervised Clustering on ServiceNow Incidents
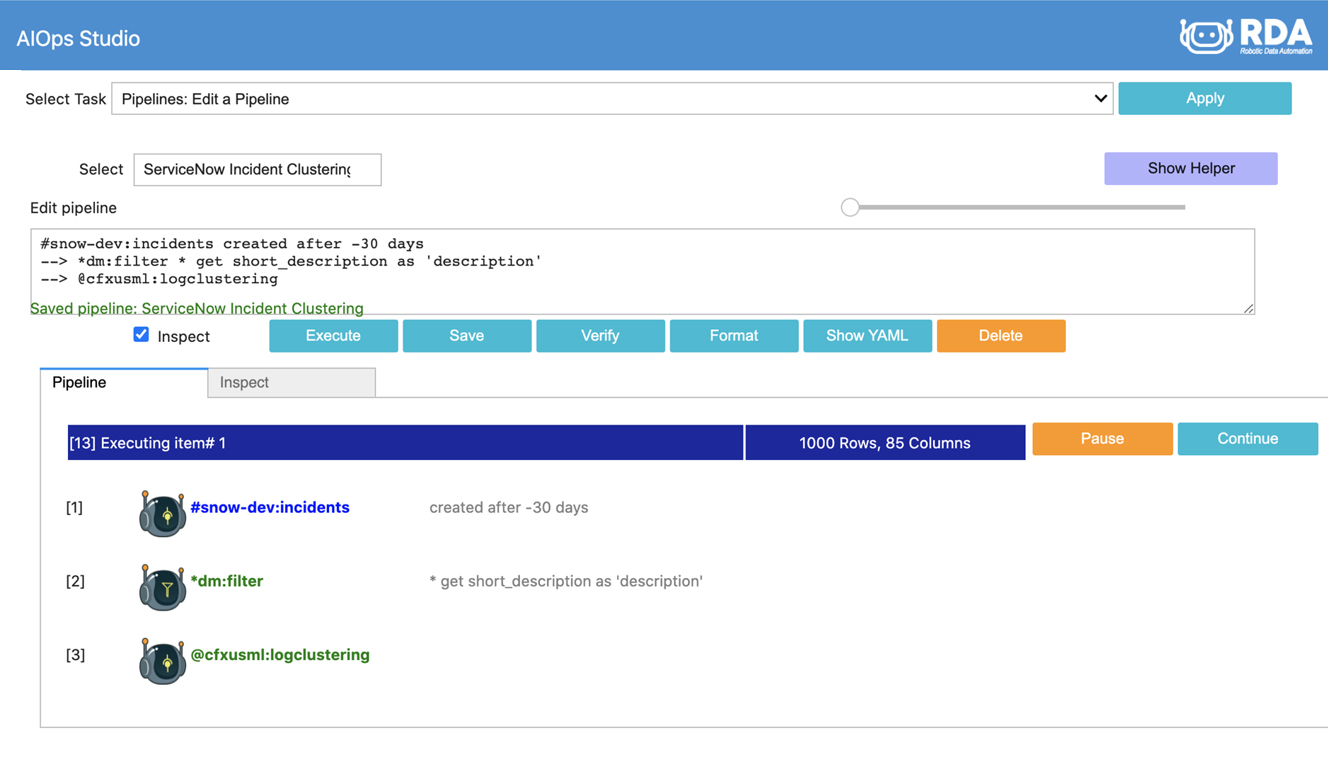
It helps to logically group or cluster incidents to understand the big picture and possibly plan for noise reduction or optimization strategies. In this pipeline, we retrieve past 30-days incidents from ServiceNow and use our native AI/ML bot to cluster incidents based on short description
*snow:incidents created is after -30 days

                      --> *dm:filter * get short_description as 'description'

                      --> @cfxusml:logclustering
Realtime Alert/Event enrichment using vROps
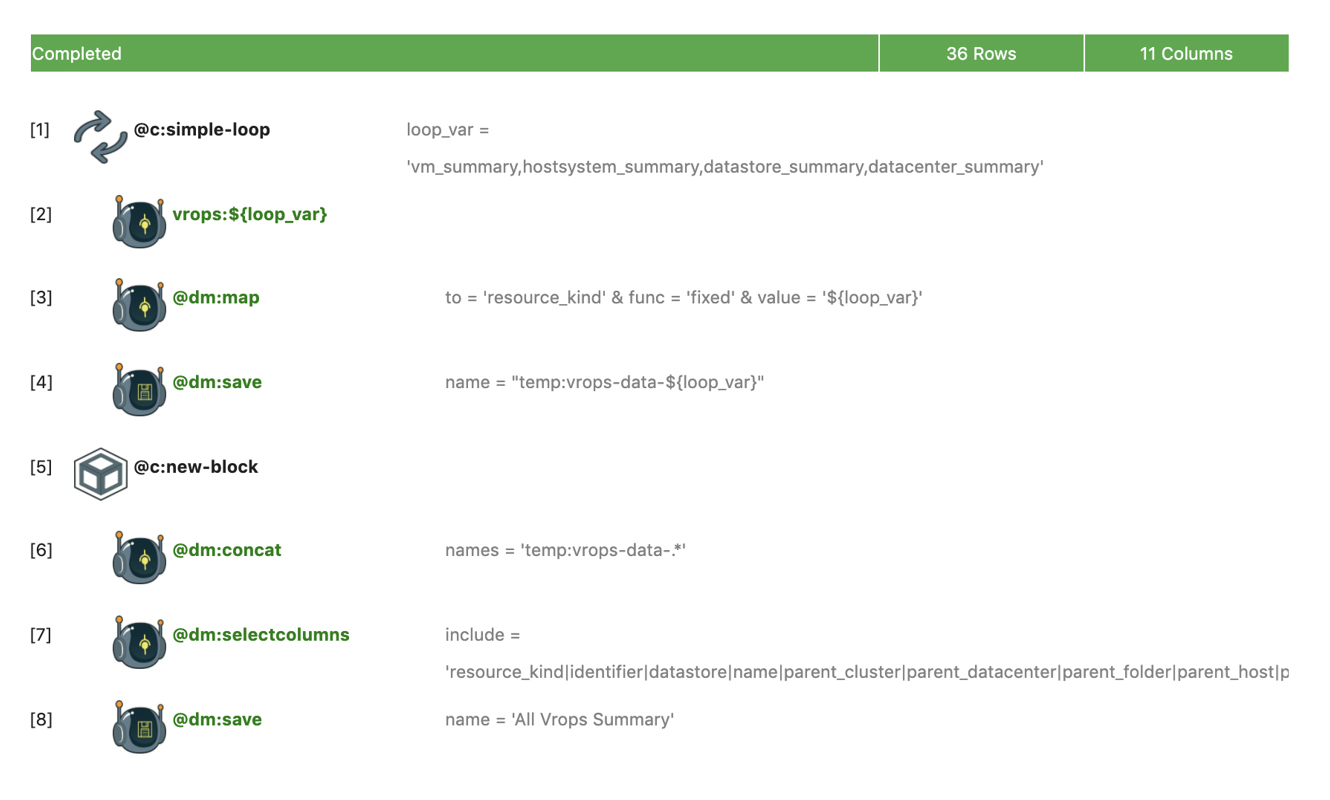
Raw alert/event data often lacks application or service context. In this pipeline, we are preparing an enrichment dataset (All VROps Summary) that builds relevant VM/Host/Datacenter/Datastore context from multiple datasets. This resultant dataset will then be used to enrich all VMware related alerts.
@c:simple-loop loop_var = 'vm_summary,hostsystem_summary,datastore_summary,datacenter_summary'

                      --> vrops:${loop_var}

                      --> @dm:map to = 'resource_kind' & func = 'fixed' & value = '${loop_var}'

                      --> @dm:save name = "temp:vrops-data-${loop_var}"

                      --> @c:new-block

                      --> @dm:concat  names = 'temp:vrops-data-.*'

                      --> @dm:selectcolumns include =  'resource_kind|identifier|datastore|name|parent_cluster|parent_datacenter|parent_folder|parent_host|parent_vcenter|guest_full_name|guest_hostname'

                      --> @dm:save name = 'All VRops Summary'
AWS EC2 VM Change Detection
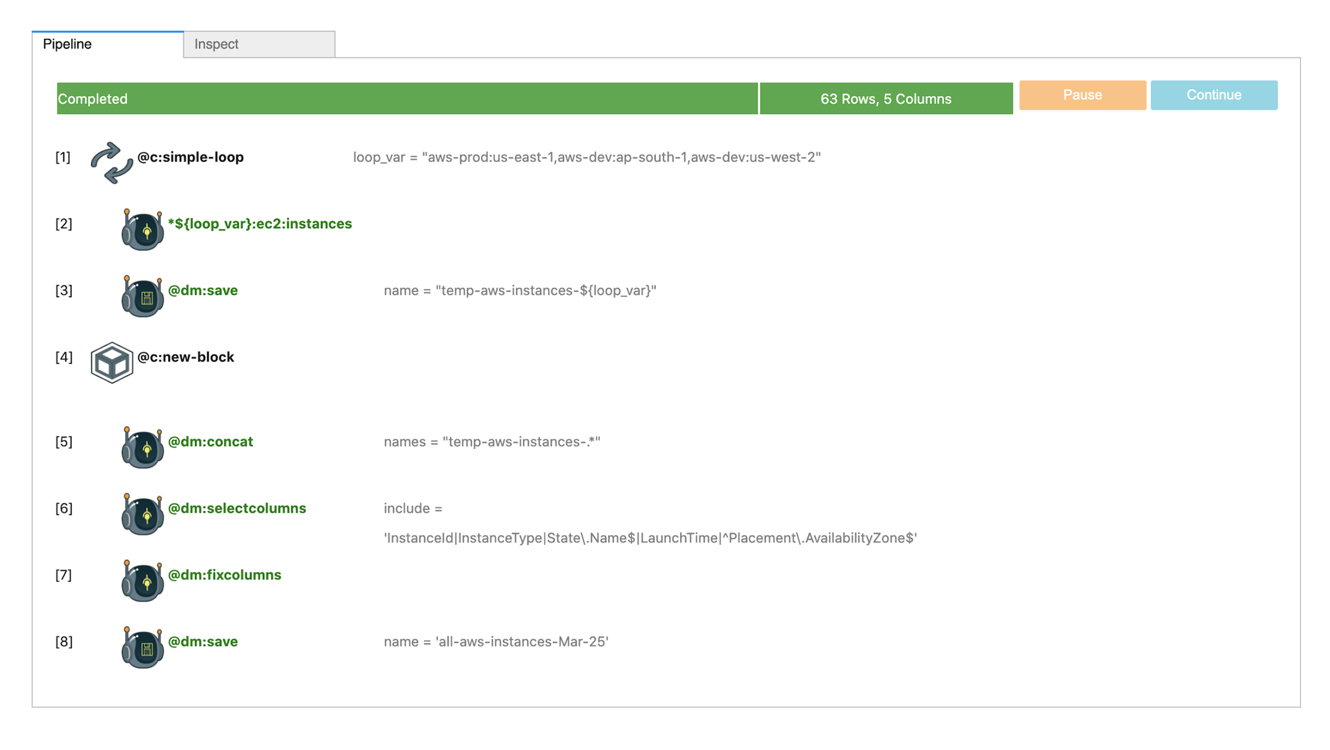
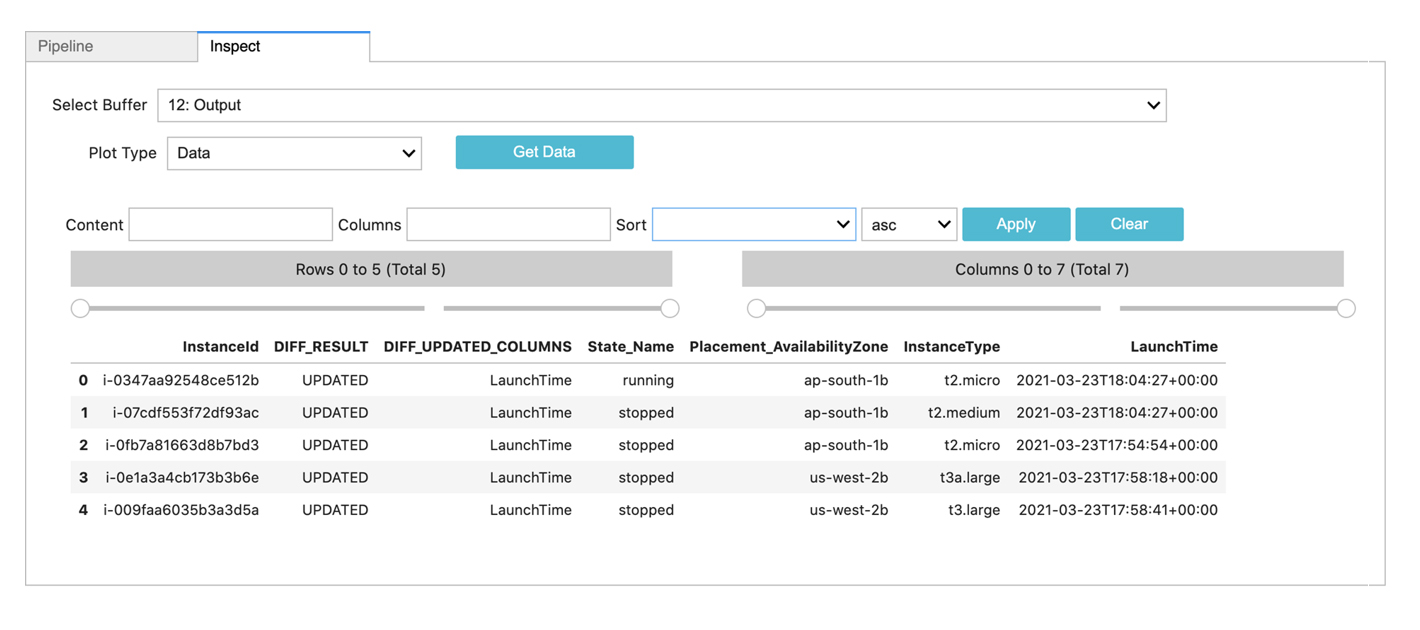
Most outages are caused by changes. Being able to detect changes is an important IT operations activity. In this scenario, we detect changes in AWS EC2 instance state. This scenario can be solved with two pipelines. In first pipeline, we take baseline (can be done daily, weekly or monthly) and in the second pipeline we take current state and compare it against baseline to identify any changes. For example, this can detect EC2 VMs that have a different state now (powered on or off)
AWS EC2 VM Baseline
 @c:simple-loop loop_var = "aws-prod:us-east-1,aws-dev:ap-south-1,aws-dev:us-west-2"

                      --> *${loop_var}:ec2:instances

                      --> @dm:save name = "temp-aws-instances-${loop_var}"

                      --> @c:new-block

                      --> @dm:concat names = "temp-aws-instances-.*"

                      --> @dm:selectcolumns include = 'InstanceId|InstanceType|State\.Name$|LaunchTime|^Placement\.AvailabilityZone$'

                      --> @dm:fixcolumns

                      --> @dm:save name = 'all-aws-instances-Mar-25'
AWS EC2 VM Compare with Baseline
@c:simple-loop loop_var = "aws-prod:us-east-1,aws-dev:ap-south-1,aws-dev:us-west-2"

                      --> *${loop_var}:ec2:instances

                      --> @dm:save name = "temp-aws-instances-${loop_var}"

                      --> @c:new-block

                      --> @dm:concat names = "temp-aws-instances-.*"

                      --> @dm:selectcolumns include = 'InstanceId|InstanceType|State\.Name$|LaunchTime|^Placement\.AvailabilityZone$'

                      --> @dm:fixcolumns

                      --> @dm:diff base_dataset = 'all-aws-instances-Mar-25' &  key_cols = 'InstanceId' & keep_data = "yes"

                      --> *dm:filter DIFF_RESULT is not "UNCHANGED"

                      --> @dm:save name = 'aws-inventory-changes'
E-Bonding: Jira to ServiceNow and Notify on Slack
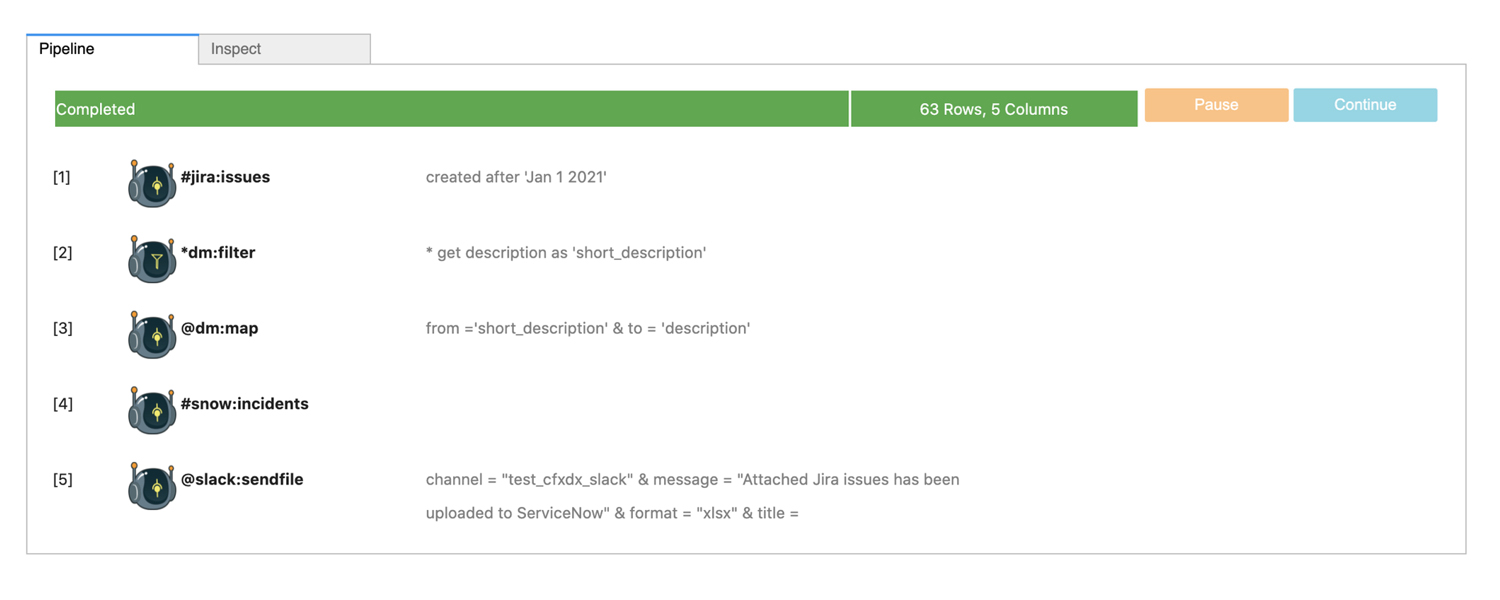
E-Bonding is the jargon or term used where you connect two siloed or disparate systems together by synchronizing or exchange desired data on a need basis. This becomes critical and also challenging as these two systems often fall under different administrative domains (ex: Customer/Vendor or MSP/Customer). E-bonding can be unidirectional or bi-depending on the use case. In this example, we take Jira issues and e-bond them to ServiceNow incidents and notify on Slack with an attachment.
 #jira:issues created after 'Jan 1 2021'

                      --> *dm:filter * get description as 'short_description'

                      --> @dm:map from ='short_description' & to = 'description'

                      --> #snow:incidents

                      --> @slack:sendfile channel = "test_cfxdx_slack" &  message = "Attached Jira issues has been uploaded to ServiceNow" & format = "xlsx" & title = "Jira_to_Snow_Ebonding_Report.xlsx"
DevOps: TeamCity Build Change Detection
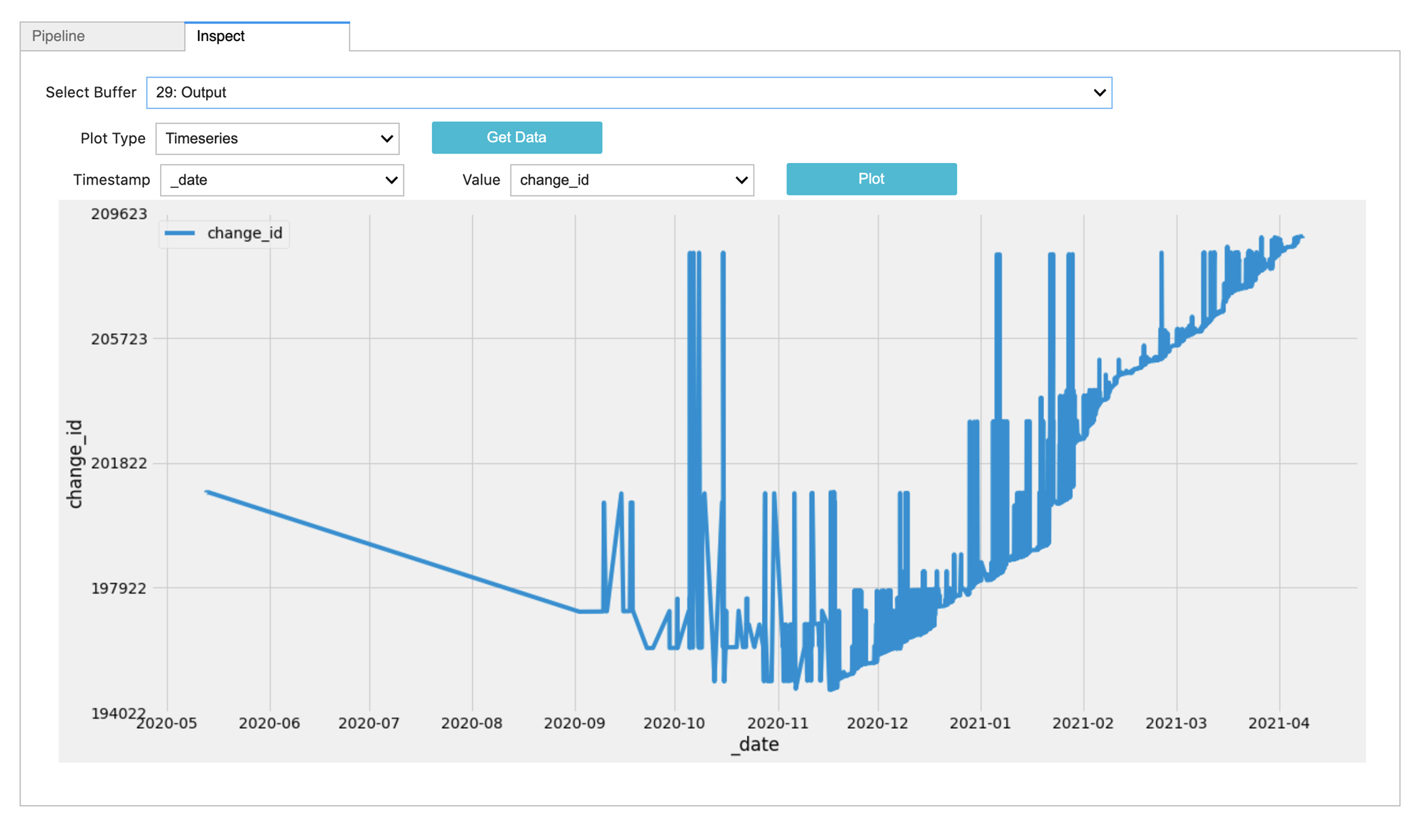
Detecting changes across release versions and reporting on it can be a important release engineering activity. In this pipeline, we take various metadata attributes from TeamCity, establish a baseline dataset and compare the current release against baseline.
 *teamcity:builds

                      --> @dm:sort columns = "id" & order = "desc"

                      --> @dm:head n = 5

                      --> @dm:save name = "temp-builds"


                      --> @c:data-loop dataset = "temp-builds" & columns = "id"

                      --> @teamcity:changes_by_build build_id = "${id}"

                      --> @dm:map from = 'id' & to = 'change_id'

                      --> @dm:map to = "build_id" & func = "fixed" & value = "${id}"

                      --> @dm:save name = "temp-build-details-${id}"


                      --> @c:new-block

                      --> @dm:concat names = "temp-build-details-.*"

                      --> @dm:selectcolumns include = "build_id|_date|comment|files|change_id|username|version"

                      --> @dm:map attr = "files" & func = "join" & sep = ","

                      --> @dm:mask columns = "username" & pos = 3

                      --> @dm:save name = "latest-build-details"
Getting Multiple Prometheus Metrics
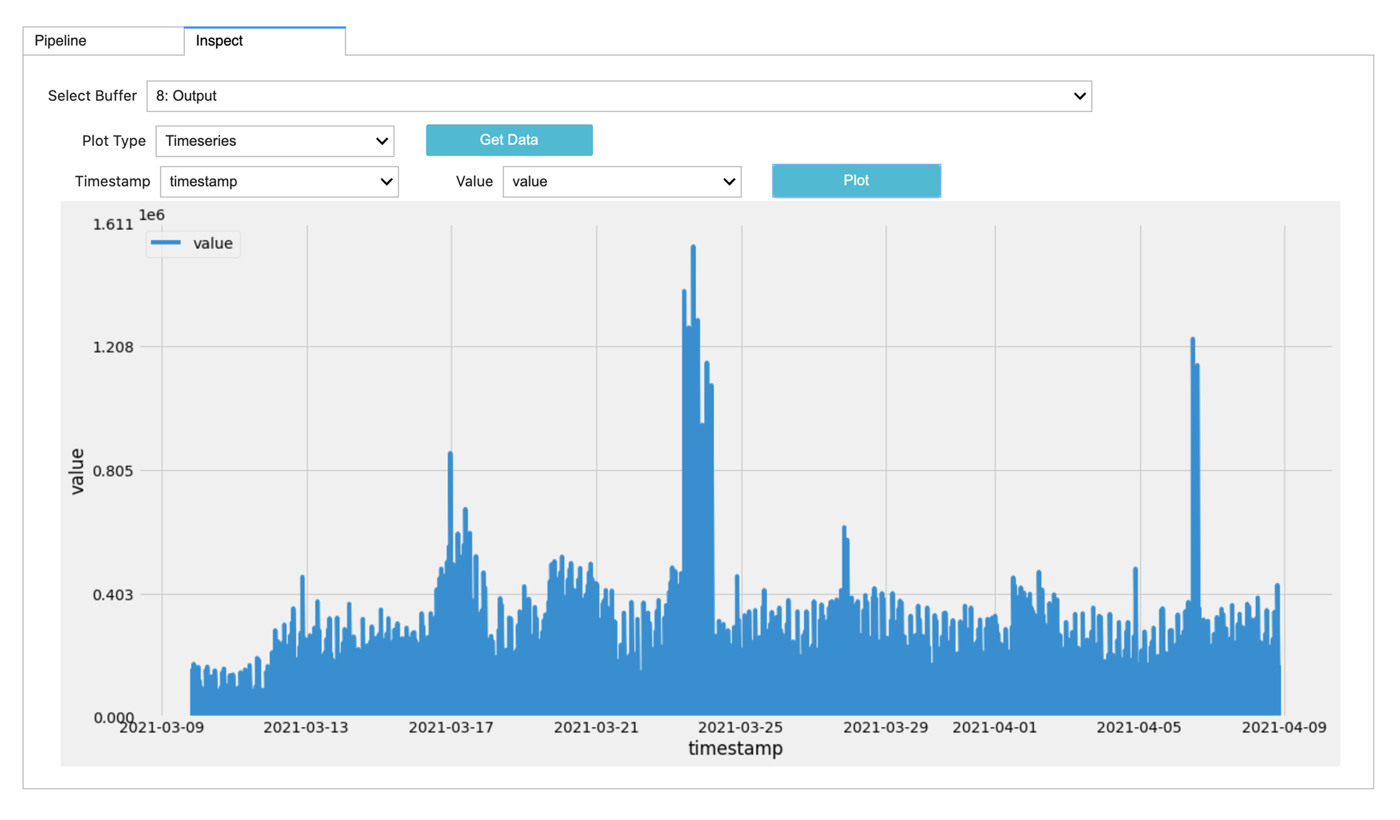
Prometheus is popular open source monitoring tool and timeseries store. In this scenario, we try to create a new dataset for Windows server CPU and Disk utilization based on data from past 30 days.
 @prometheus:metric-range metric is '100 - (avg by (instance)
 (irate(windows_cpu_time_total{mode="idle"}[1m])) * 100)'& timestamp is after -30 days & step is '60m'

				--> @dm:map to = "metric_name" & func = "fixed" & value = "cpu_usage_percent"

				--> @dm:save name = "temp-metric-cpu"


			--> @c:new-block

				--> @prometheus:metric-range  metric is 'avg by (instance) (disk_write_bytes_bytes_average)' & timestamp is after -30 days & step is '60m'

				--> @dm:map to = "metric_name" & func = "fixed" & value = "disk_writes"

				--> @dm:save name = "temp-metric-disk-wr"


			--> @c:new-block

				--> @dm:concat names = "temp-metric-.*"

				--> @dm:map from = "instance,metric_name" & to = "metric_name" & func = "join" & sep = "-"
Data Enrichment using Nagios Service Groups and Host Groups
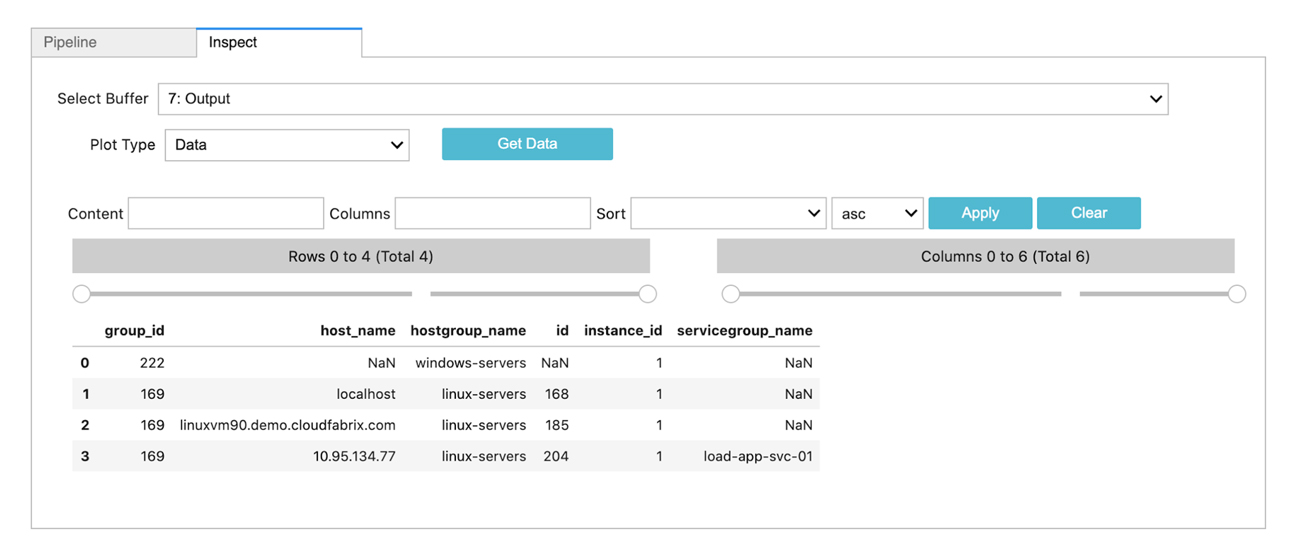
Nagios is a popular open source monitoring tool. In this scenario, we try to create a enrichment dataset using Nagios service group members and host group members. Using this enrichment dataset, we can add host or service context to any raw alerts or events originating from other tools in the tech-stack.
 *nagios:nagios_service_group_members

					 --> dm:save name = 'nagios-service-group-summary'

					 --> @c:new-block

					 -->  *nagios:nagios_host_group_members

					 --> dm:save name = 'nagios-host-group-summary'

					 --> @c:new-block

					 --> dm:recall name = 'nagios-host-group-summary'

					 --> @dm:enrich dict = 'nagios-service-group-summary' & src_key_cols = 'host_name' & dict_key_cols = 'host_name' & enrich_cols = 'servicegroup_name'

					 --> dm:save name = 'nagios-host-group-members'
