Observability
Unified Observability lens to your Full-Stack, Hybrid-Cloud environment
Bring together metrics, logs, traces and events from your multi-cloud environment for your DevSecOps and SRE teams
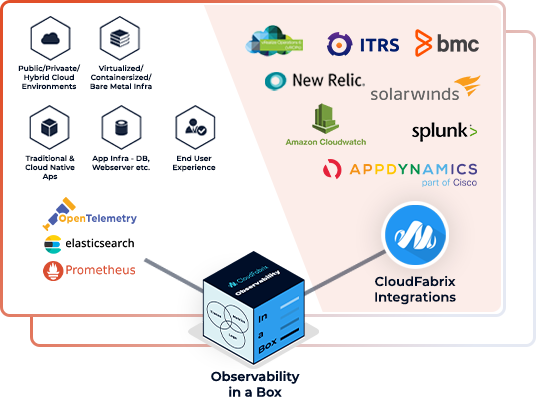
Observability in a Box Solution Approach
Unified Observability based on Open Source & Open Telemetry
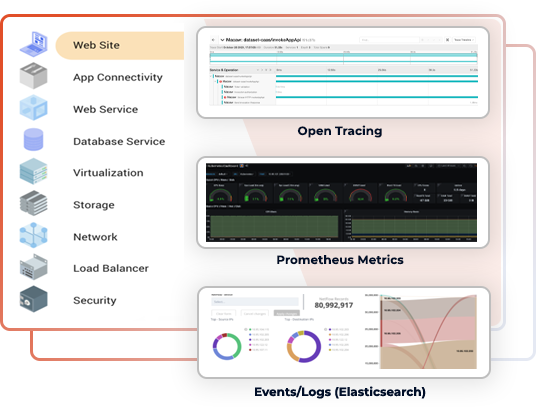
- Proactive monitoring and reporting - Enabled by Prometheus and Grafana
- Log and Event ingestion and reporting - Enabled by ELK stack
- Application traces ingestion and reporting - Enabled by Open Telemetry, Jaeger
- Continuous Asset Discovery and relationship discovery - Enabled by cfxEdgeCollector
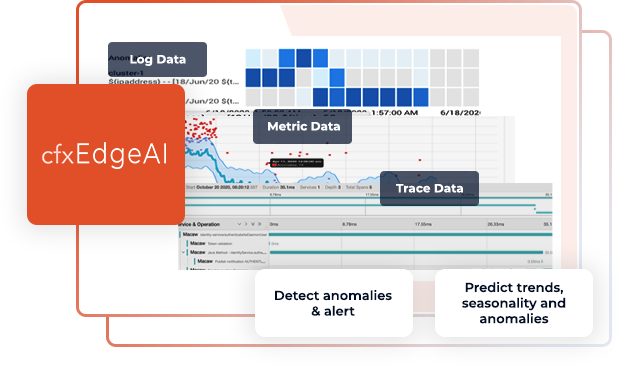
- Anomaly detection and automatic alerting - Enabled by cfxEdgeAI

Why Observability In A Box
To search, analyze and visualize data across logs, metrics, APM traces and events in the context of desired asset(s)
Productivity
- Real-time and on-demand Observability to Dev, Ops and SREs
- Leverage AI/ML to surface anomalies without expensive rules
Uniformity
- API and SQL like query interface to access any data
- Standardize practices and processes to ingest and access observability data
Cost Efficiencies
- Reduce license, deployment, and operations costs
- Address any gaps quickly and future proof the system with robust open source framework
Capabilities
Native observability support plus 3rd party tools integration
CloudFabrix Observability solution comes with native support of monitoring infrastructure, application, services of both traditional and cloud native architectures with metrics, logs and traces using open source technologies. Customers can also ingest data from 3rd party tools to standardize access of observability data across the enterprise.


AI/ML At The Edge
CloudFabrix Observability solution brings AI/ML capabilities to the edge and closer to the data for faster response and efficient data handling. The solution can quickly surface anomalies as well as provide predictive insights by applying machine learning at the edge. This ensure alerts are raised much quicker compared to the situation where the data is required to be sent to a centralized location for analysis.
Asset & Full-Stack Context
CloudFabrix Observability solution comes integrated with asset discovery/dependency capabilities along with the correlation of observability data with the assets. With this capability, users can search, analyze and visualize data in the context of a desired asset or service when working on things like finding root cause etc. Users can also build custom dashboards and metrics from the different data that is collected at the asset/full-stack level.

Integrations

Use Cases
Build & run Observability pipeline to collect metrics, logs and traces for a cloud native application
Build & run observability pipeline using software bots to collect time-series performance metrics, events or logs, and application traces for cloud-native application stacks (ex: microservices / containers) running on any public cloud environment, leveraging cloud integration bots and open instrumentation agents.
Benefit: Cost Reduction, Reduced Application Incidents
Unified Open Observability for any Traditional Application Stack
Build & run observability pipeline using software bots to collect time-series performance metrics, events or logs & application traces for traditional 3-tier or client-server application stacks running on-premise and hybrid environments, leveraging integration bots for packaged applications, ITOM tools and open instrumentation.
Benefit: Upto 100% edge observability
Deliver Observability Data to Messaging Systems, Analytics Tools or Data lakes
Build pipelines to deliver metrics, events, logs, or traces to popular messaging systems (ex: Kafka, NATS, AWS SQS/SNS …), analytics tools (Spark), or data lakes (Ex: Splunk or Elasticsearch / Kibana).
Benefit: Faster Integrations, faster time to value
Unified Open Observability for Edge Workloads / IoT Devices
Enable complete open observability for edge workloads and IoT devices using remote data collection modules, streaming data bots, message delivery, log serving, and more.
Benefit: Upto 100% edge observability
Build Custom Observability Reports
Customize and schedule generation of observability reports including Availability & Uptime, Performance Report, Alerts, and Incidents Report, Assets Inventory Report, Asset Configuration Report Server Events Report, Network Events Report, Security Events Report and more.
Benefit: Real time visibility, Productivity gains.
Automate Observability tooling and integrate with DevOps process
Automate configuring the virtual and container instances for continuous observability of OS and application/service level metrics, logs and traces as per the policy. This can be integrated with the DevOps process so every infra/application instances that gets deployed in QA/Staging/Production will be completely observable
Benefit: Continuous Observability.
Dynamic alert condition detection
Traditional approaches rely on DevOps/SRE engineers to configure rules to generate alerts. However, in dynamic environments this is not scalable and opens up the risk of missing alerts. By using this solution pack , key metrics, logs and traces will be continuously analyzed for understanding patterns and detecting anomalies. These anomalies can then be notified as alerts.
Benefit: Fewer outages or missed alerts
Predict Trends & Anomalies for a given time-series data
Collect , analyze and predict the trends and anomalies on any time series data collected from the underlying observability tools. New KPIs can also be defined that will be computed from the underlying metrics. The solution also supports converting log data into time-series data extending the prediction capabilities to log / unstructured data.
Benefit: Improved IT reliability
